CAN-Demo-ESP32: DBC-Driven CAN Bus Communication with LVGL on Dual ESP32
The Problem
CAN bus is everywhere in automotive and industrial embedded systems — it is the backbone carrying sensor data, actuator commands, and diagnostics between ECUs. But when you sit down to build a complete CAN demo from scratch, you quickly realize the gap between a single-line tutorial (“here is how to send a byte”) and what a production system actually looks like.
You need to wire transceivers, configure timing at 500 kbps, handle message filtering in hardware, parse multi-byte signal layouts, drive a graphical display, and make the whole thing robust enough to survive a disconnected bus without locking up. Most demos stop at showing raw bytes on a serial monitor. I wanted something that treats CAN messages as structured types — with speed and turn_signal fields, not bit-shifted hex — and that shows how to architect firmware that is testable, extensible, and safe.
This project is a dual-ESP32 CAN bus reference implementation that bridges that gap. One board transmits instrument cluster data over CAN; the other receives it, displays a speedometer on a TFT touchscreen, and drives physical relay indicators. Under the hood, every design decision — DBC-driven code generation, an event-driven pub/sub architecture, and a state machine with automatic graceful degradation — is chosen to reflect patterns I would want to see in a real embedded system.
The Approach
The hardware setup is straightforward: two ESP32 boards, each connected to a CAN transceiver (TJA1050 or SN65HVD230), sharing a twisted-pair CAN bus with 120-ohm termination at both ends. The TX board acts as a signal generator, constructing Cluster frames containing a 12-bit speed value and two 1-bit turn signal indicators. The RX board receives those frames through a CAN mailbox filter, unpacks them into typed data, and fans the decoded values out to an LVGL dashboard on a TFT display and to physical relay outputs. The firmware is built from a single PlatformIO project that produces two completely different binaries via environment-based source filtering.
The architecture rests on three pillars:
1. DBC as the single source of truth. Every CAN message is defined in a .dbc file — the industry-standard CAN database format. A code generator compiles the DBC into C structs (Cluster_t) and functions (Pack_Cluster_lecture, Unpack_Cluster_lecture). The firmware never manually parses bytes; it works exclusively through the generated API. When the message layout changes, you edit the DBC, re-run the generator, and rebuild. No hunting for stale bit shifts across source files.
2. Event-driven architecture with pub/sub routing. CAN frames arrive in an ISR, get validated and unpacked there, and are immediately pushed onto a FreeRTOS queue. A main-loop dispatcher drains the queue, publishes typed messages through a central MessageRouter, and lets UI and I/O modules subscribe independently. The ISR does exactly three things — validate, unpack, queue — and never touches application state.
3. Graceful degradation with automatic recovery. A HealthMonitor tracks the time since the last valid CAN frame. If 1500 milliseconds pass without data, the system transitions from Active to Degraded: the display shows a yellow warning overlay, outputs are gated to a safe state, and the UI freezes at the last known values. When frames resume on the bus, the system auto-recovers back to Active without any manual intervention.
Key Technical Details
DBC-Driven Code Generation
The CAN database file tools/Lecture.dbc defines a single message — Cluster with ID 101 (0x65 in hex), carrying 3 bytes of payload. Three signals are packed into those bytes: speed at bits 9 through 20 (12-bit, 0-4095), Left_Turn_Signal at bit 8 (1-bit), and Right_Turn_Signal at bit 21 (1-bit). The bit positions, scaling factors, and range constraints are all encoded in the DBC.
The c-coderdbc tool (from astand/c-code-generator-from-dbc) compiles this DBC into lib/Generated/lib/lecture.h and lecture.c, producing:
// Auto-generated from Lecture.dbc — do not edit
typedef struct {
    uint16_t speed;              // 12-bit, 0–4095
    uint8_t  Left_Turn_Signal;   // 1-bit
    uint8_t  Right_Turn_Signal;  // 1-bit
} Cluster_t;

void Pack_Cluster_lecture(const Cluster_t* src, uint8_t* dst, uint8_t* dlc, uint8_t* ide);
void Unpack_Cluster_lecture(Cluster_t* dst, const uint8_t* src);
The TX board calls Pack_Cluster_lecture to encode, the RX board calls Unpack_Cluster_lecture to decode. There is not a single manual bit shift in the entire firmware. This is the pattern I want to see become default in embedded CAN development — the DBC is the contract, and generated code enforces it.
The Event Pipeline: ISR to Display
When a CAN frame arrives at the RX board, it travels through a strictly ordered pipeline where each stage has a single responsibility:
Stage 1 — ISR (CanInterface::CanMsgHandler): Validates the frame (ID must be 0x65, DLC ≥ 3, standard frame format), calls Unpack_Cluster_lecture to decode the payload into a Cluster_t, and pushes Event::ClusterFrame onto the EventQueue using the ISR-safe PushFromISR path. Total ISR execution is a few dozen microseconds — validate, unpack, queue, return.
Stage 2 — Processing Task: A FreeRTOS task pinned to Core 0 drains the event queue with a non-blocking Pop in a tight loop. Each ClusterFrame event is dispatched through SystemController, which publishes the Cluster_t struct to the MessageRouter along with a millis() timestamp.
Stage 3 — Fan-out: The MessageRouter is a typed pub/sub bus with sticky last values. Subscribers register callbacks for specific topics. When PublishCluster is called, every subscriber’s callback fires — UiController receives the speed and signal state, IOModule receives the same, and HealthMonitor pulls the last-seen timestamp to check for staleness.
// Simplified ProcessingTask loop (runs on Core 0)
Event event;
while (eventQueue.Pop(event, 0)) {
    systemController->Dispatch(event);
}
systemController->Update();
ioModule.Update(millis());
vTaskDelay(1);  // yield CPU
This decoupling means adding a new consumer — say, an SD card logger — requires only a new subscriber callback. No existing code changes, no wiring to untangle.
State Machine with Graceful Degradation
The SystemController state machine has six states that map naturally to the lifecycle of a device on a shared bus:
- Boot → DisplayInit → WaitingForData → Active ↔ Degraded → Fault
After boot and display initialization, the system idles in WaitingForData until the first CAN frame arrives. Once in Active, the HealthMonitor polls the MessageRouter’s last-seen timestamp every tick. If 1500 milliseconds elapse without a fresh frame — the TX board was disconnected, the bus was physically severed, or the transmitter crashed — the monitor emits a single FrameTimeout event. The controller transitions to Degraded, which applies a yellow “STALE DATA” overlay to the TFT, freezes the UI at the last valid readings, and gates the relay outputs to a safe (off) state.
The critical design choice is the edge-triggered timeout — the monitor emits exactly one FrameTimeout per stale period rather than flooding the queue with redundant timeout events. And the auto-recovery path (Degraded → Active on the next valid frame) eliminates the need for a hardware reset or watchdog intervention when the bus comes back.
Dual-Firmware, Single Repository
Rather than maintaining two separate PlatformIO projects, the platformio.ini defines two environments — rx_board and tx_board — that share common code through the build_src_filter directive:
[env:rx_board]
build_src_filter =
    +<rx/**>
    +<common/**>
    +<generated_lecture_dbc.c>
    -<tx/**>
    -<main.cpp>

[env:tx_board]
build_src_filter =
    +<tx/**>
    +<common/**>
    +<generated_lecture_dbc.c>
    -<rx/**>
    -<main.cpp>
lib_ignore = Ui, lvgl_conf, TouchLibrary, Display
The TX environment ignores LVGL, TFT_eSPI, and the touch library entirely — it compiles to a minimal binary that does one thing: construct Cluster frames and send them at 10 Hz. The RX environment links the full LVGL v9.1 stack alongside TFT_eSPI for display and a custom touch library for the NS2009 touch controller. Both environments compile the same DBC-generated wrapper (generated_lecture_dbc.c) and the shared CAN driver abstraction under lib/CanDriver/, which supports three controllers — built-in TWAI, MCP2515 (SPI classic CAN), and MCP2517FD (SPI CAN FD) — behind a unified interface.
LVGL on a Dedicated Task
The UiController runs LVGL v9.1 on its own FreeRTOS core (Core 1), decoupled from the CAN receive pipeline on Core 0. Communication between the two tasks happens through thread-safe queues — an overwrite queue (length 1) for the latest UiData payload (speed arc value, turn signal state) and a message queue (length 10) for commands like ShowDashboard, ShowDegraded, and AddLogLine.
The dashboard screen, designed in SquareLine Studio and exported to lib/Ui/, shows a speed arc gauge and turn signal indicator labels. The arc value is linearly mapped from the raw 0–4095 speed signal to a 0–240 range. Turn signal labels toggle opacity between 0 (off) and 255 (on) with a 500 ms blink cadence managed inside the UI task. A second screen holds a log box displaying the last 10 system log lines, switchable via touch or command.
The relay module (IOModule) runs a separate 1 Hz blink timer independent of both the CAN message rate and the UI blink cadence, with phase synchronization on the rising edge of each turn signal request — so the physical relay always starts in the ON phase when a signal activates, even if the CAN frame arrives mid-cycle.
Architecture Diagrams
1. System Overview
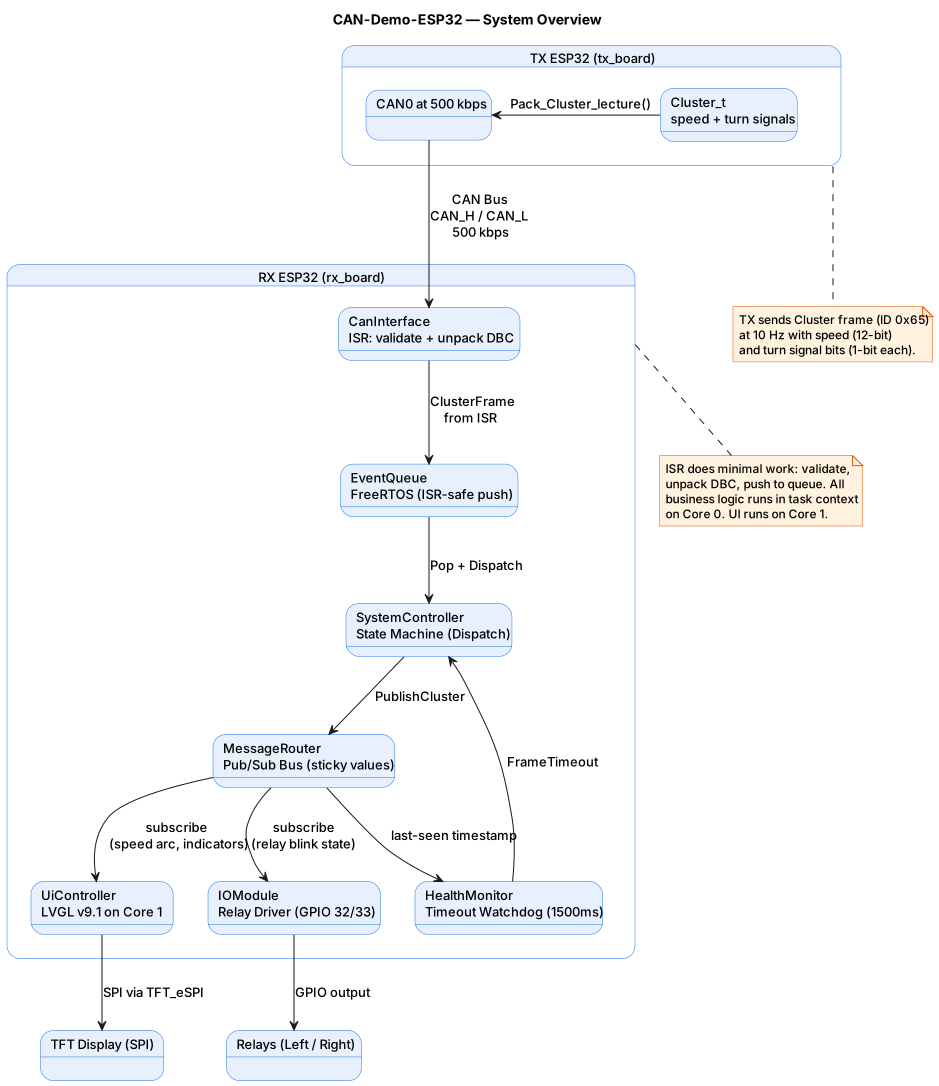 The complete system architecture. A TX board generates Cluster frames (ID 0x65) containing speed and turn-signal data at 10 Hz. The RX board receives them via CAN, unpacks them through auto-generated DBC functions, and routes the decoded values through a pub/sub MessageRouter to an LVGL TFT dashboard on Core 1 and physical relay outputs on Core 0. A HealthMonitor pulls the last-seen timestamp to detect bus disconnection.
2. RX State Machine
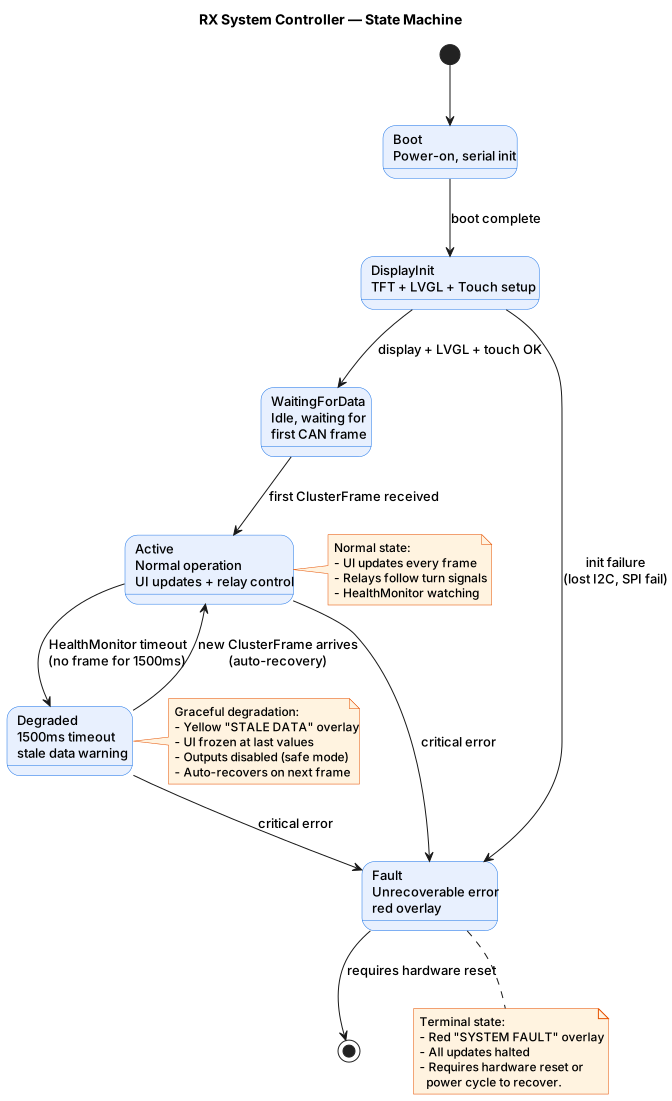 The RX firmware state machine. After boot and display initialization, the system waits for its first CAN frame. Once in the Active state, a HealthMonitor enforces a 1500 ms timeout — if no frames arrive, the system degrades gracefully instead of freezing. The critical design choice is the Degraded-to-Active auto-recovery path, which eliminates the need for a hardware reset when the TX board resumes transmission.
3. Event and Data Flow
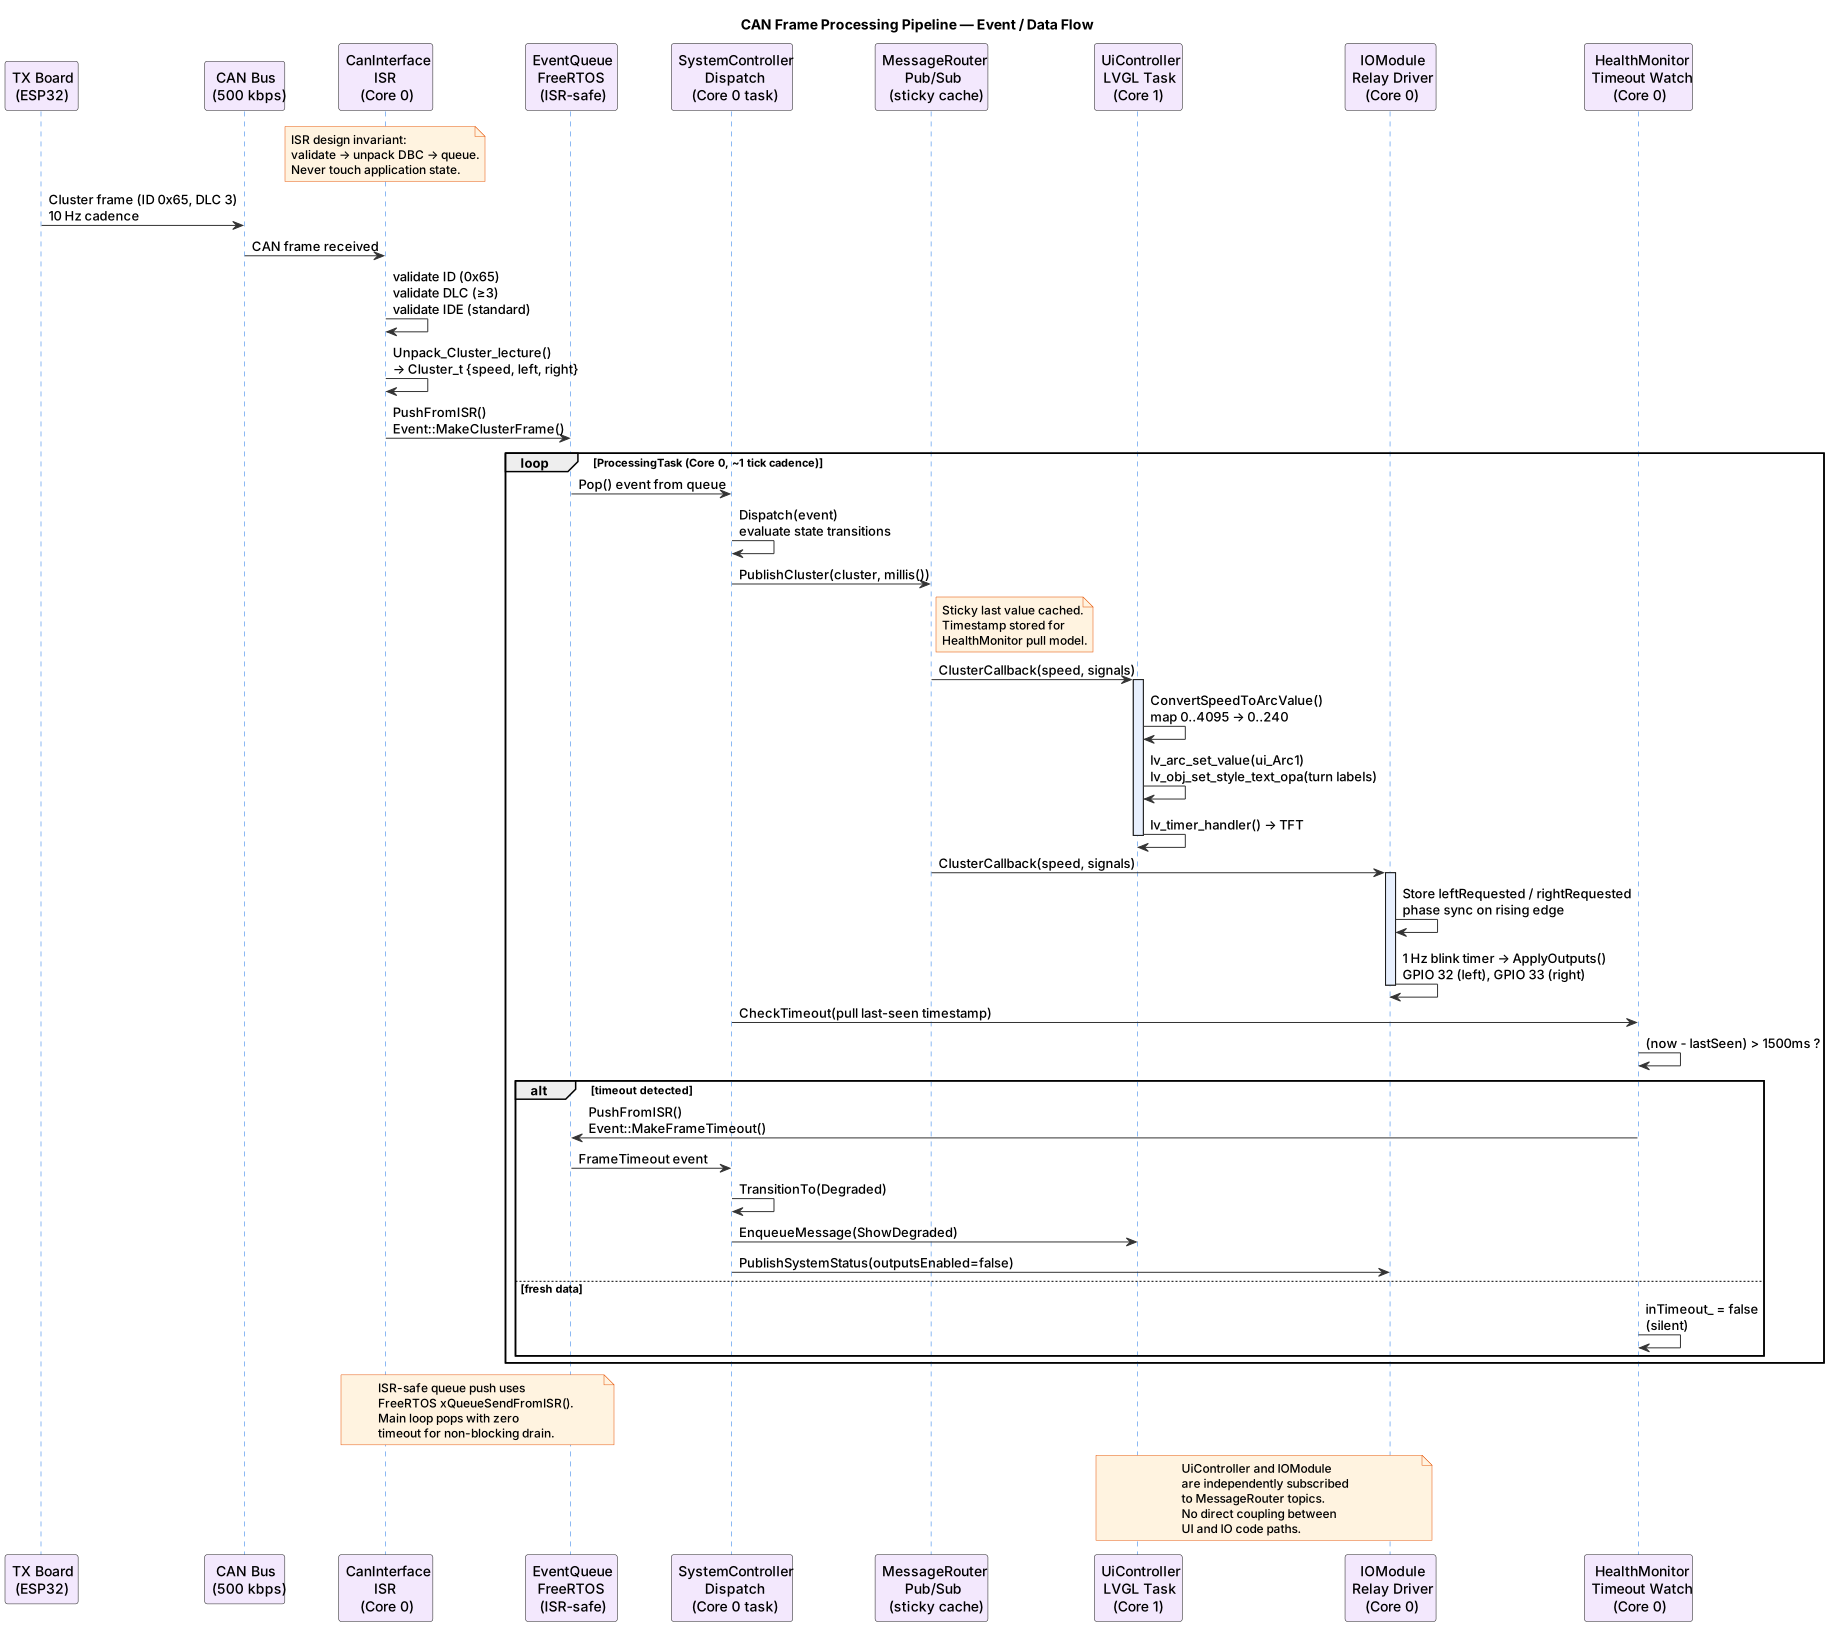 The complete frame processing pipeline from CAN transceiver to display and relays. The architectural invariant is that the ISR does minimal work — validate, unpack DBC, queue — while all business logic runs in the ProcessingTask on Core 0. The MessageRouter fans typed data out to independently subscribed consumers, and the HealthMonitor operates on a pull model against the router’s cached timestamp.
4. DBC-to-Code Workflow
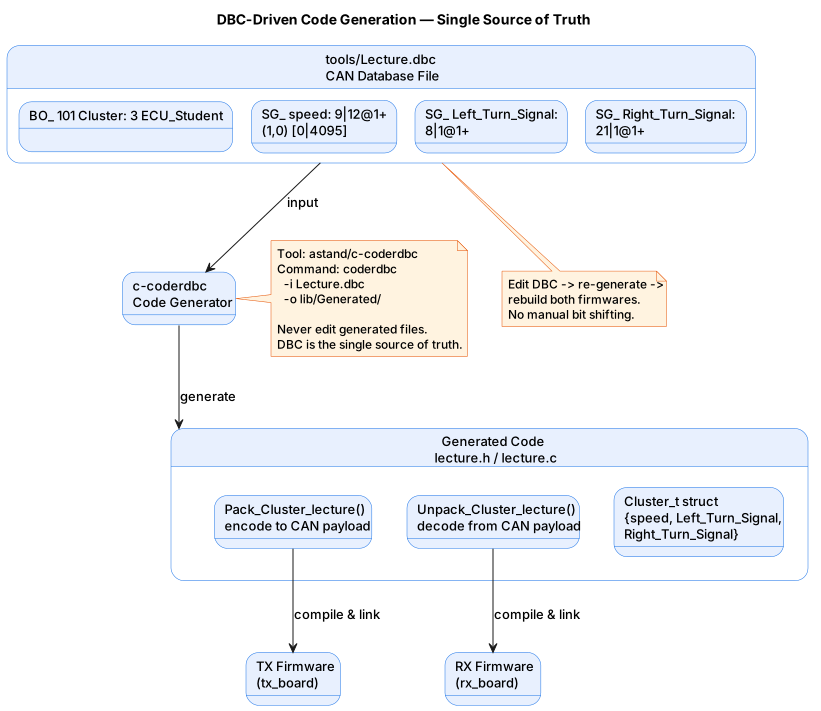 The DBC-driven code generation workflow. The CAN database file
 Lecture.dbc is the single source of truth for message definitions. The c-coderdbc tool compiles it into C structs and Pack/Unpack functions. The TX firmware uses the Pack function to encode frames; the RX firmware uses the Unpack function to decode them. Any change to the message layout happens in the DBC, and generated code updates deterministically — no manual bit parsing anywhere in the system.
What I Learned
DBC tooling changes your relationship with CAN data. Once you have a single source of truth that produces validated Pack and Unpack functions, manually shifting bits in raw byte buffers feels archaic — and error-prone. The Cluster_t struct with named fields, a defined range for speed, and bit-level placement handled by the generator caught layout bugs before they ever hit hardware. The edit-compile-rebuild loop (edit DBC → re-generate → rebuild both firmwares) is fast enough to be the default workflow, and it eliminates an entire class of bit-level framing errors.
Event-driven architecture on a microcontroller is not overengineering. The ISR → queue → dispatcher → pub/sub MessageRouter pattern proved its value the first time I added the IOModule. It subscribed to the same topic the UI was already consuming — no wiring changes, no coupling, no risk of breaking the display path. The HealthMonitor was similarly a drop-in consumer of the router’s last-seen timestamp. When your modules only talk through typed topics, adding features becomes a matter of adding subscribers, not refactoring control flow.
The educational angle shaped the design. The TX board’s main.cpp is intentionally a partially-completed exercise with TODO comments for the Pack logic, message ID, and DLC configuration. This means someone learning CAN can start by completing a single Pack function — they do not need to understand the entire RX state machine, the LVGL task split, or the pub/sub router. The comprehensive 10-test testing guide (5 functional, 3 regression, 2 performance) adds a layer of rigor that reinforces the idea that embedded firmware deserves the same testing discipline as any other software. Designing for the learner’s on-ramp — and for the reviewer’s sign-off checklist — made this more useful than another polished-but-opaque demo.